Queensland’s autocratic former premier Sir Joh Bjelke-Petersen famously gauged the strength of the state’s economy by the number of cranes visible on the Brisbane skyline.
That tradition has lived on through construction management company Rider Levett Bucknall’s crane index, released on Thursday, which recorded a 12 per cent rise in the number of cranes in the Queensland skyline in a six-month period.
The number sat at 73 in the third quarter of 2025, with 28 new cranes outpacing the 20 that came down in the first quarter. They were on 42 residential, seven mixed-use, nine health and five civil project sites across the city.
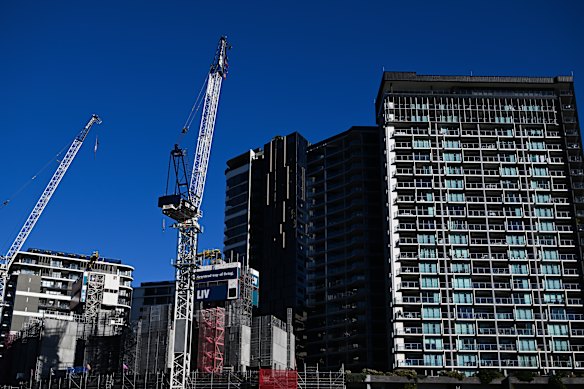
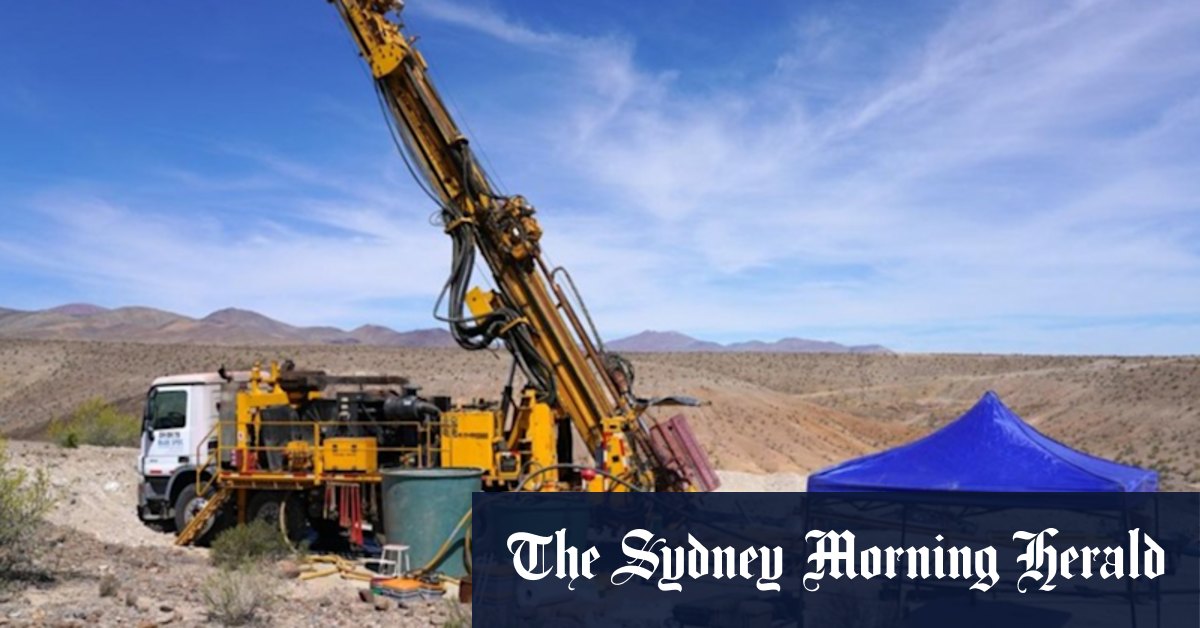
Rider Levett Bucknall does a count of cranes across Brisbane every six months.Credit: Dan Peled
RLB Queensland director Jamie Smith said Sir Joh was on to something, as crane index was a “fairly ready and simple measure” of the construction and property market.
“We update it every six months – biannually – and we’ve been doing that since 2013, so we weren’t on to it quite as early as Sir Joh,” he said.
Loading
Smith said the stats for Brisbane – and south-east Queensland as a whole – showed a shift in construction towards residential developments. More than half the cranes in Brisbane were in the housing sector.
“This is a bit of a transitional phase, because we’ve had some major projects over the last six to 12 months where they’ve reached a stage of the project they can pull their tower cranes down – for example, Queen’s Wharf is in the not-too-distant memory and also some of the Cross River Rail Station boxes a little more recently,” he said.
“The uptick this time is more so in residential projects, and a lot of that has been in the inner suburbs, so if you think of your Newsteads, your Fortitude Valleys and so on, where there’s a bit of urban renewal.
“It’s been going for some time, but it’s continuing, and we’ve seen an uptick in activity in those areas and along some of the major arterials.”
But things were about to change again, Smith said, in no small part due to the 2032 Olympic Games.
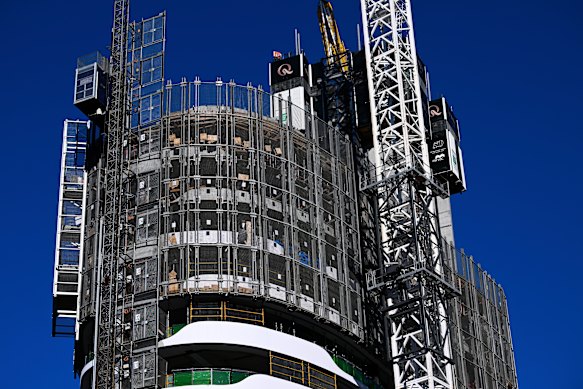
The crane index was still well below its 2015 and 2016 peak.Credit: Dan Peled
“There’s this pretty substantial pipeline that’s in front of us, particularly in terms of the major public sector projects,” he said.
“Some of the health projects have started, some are yet to commence on site.
“The Olympic venues are obviously very topical. There are other parts of the state government’s capital portfolio – think education, housing, corrections and the like – that will start to on site. Even if they’re in planning at the moment, they may not have started on site yet, so they might start to come in over the next six to 12 months.
Loading
“That’s what we mean by the transition being between some of the major project infrastructure and private sector jobs that have come to a close over the last six to 12 months, and then forward-looking at a new pipeline of work coming towards us.”
Smith said that would come with its own challenges, with “tier one” builders likely to shift their focus to large-scale developments, which would put a strain on large-scale apartment and living sectors.
While Brisbane had experienced growth in the index, it was still well below its 2015 and 2016 peak of 104, which was fuelled by the apartment boom.
The Gold Coast, meanwhile, was not far behind Brisbane with 67 cranes in the latest count – the highest number since RLB started counting in the city in 2015 and more than any other Australian city apart from Brisbane, Sydney (370) and Melbourne (199).
“The Gold Coast has been a very strong market,” Smith said.
“They’ve had, in terms of property and construction, the benefit of some pretty significant growth in interstate migration – it’s been a very attractive area over many, many decades for people to move to, particularly over the last five years,” he said.
“The crane count on the Gold Coast is not that far behind Brisbane as the capital, but it’s a significant market in its own right these days.
“It’s almost like a maturing of the market – the Gold Coast historically had a bit of a reputation as boom and bust, but it seems that it may have matured a lot and it’s inevitably weighted towards residential.”
As for how RLB calculated the count, it was as simple as it sounded – a physical count.
“We do a physical visit around the city, so it takes a few days of time,” Smith said.
“We also then cross-reference that to some satellite imaging, which is more current than Google, and we sanity-check it when it comes back to the office and compare it to the last time.
“We run our checks and balances – we don’t want to put out something that someone’s going to pick holes in.”
Start the day with a summary of the day’s most important and interesting stories, analysis and insights. Sign up for our Morning Edition newsletter.
Most Viewed in National
Loading